Back to Archive![12 highlights from 2022]()
![PositiveMoney - Post]()
![PositiveMoney - Post]()
![PositiveMoney - Post]()
![PositiveMoney - Post]()
![PositiveMoney - Post]()
13 March 2015
What can we learn from the England’s Housing Survey?
The Department for Communities and Local Government recently released its Housing Survey for England*.


The Department for Communities and Local Government recently released its Housing Survey for England*. The report ultimately confirms what Positive Money has been putting forward for many years, that the housing bubble continues to be a massive driver of inequality and that more and more people are being ‘priced out’ of the housing market. Certain statistics show that this is not only due to a shortage of housing, implying it is also due to the banking sector’s ability to create money out of thin air.
For the first time since the housing survey began in 1980, more people owned a property outright than those buying a house with a mortgage (Figure 1: Trends in Tenure, 1980-2014).


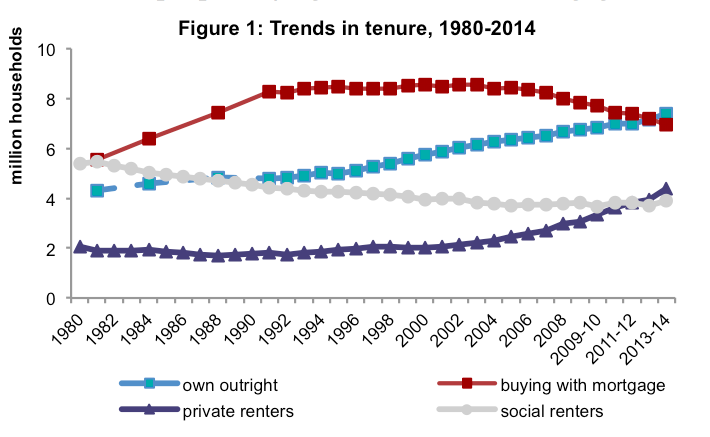
After 2007, the number of people buying a house with a mortgage declined. This can be explained by: 1) after a bust more and more people became more concerned with paying down their debts then taking out new loans, and 2) more people simply cannot afford a mortgage. The latter is most likely the case when considering that number of private renters remained steady from 1980 through to 2004, until it doubled from 2004-2014.
This trend is unsurprisingly most prominent in London (Figure 2: Trends in tenure London, 2003-2004 vs. 2013-2014).


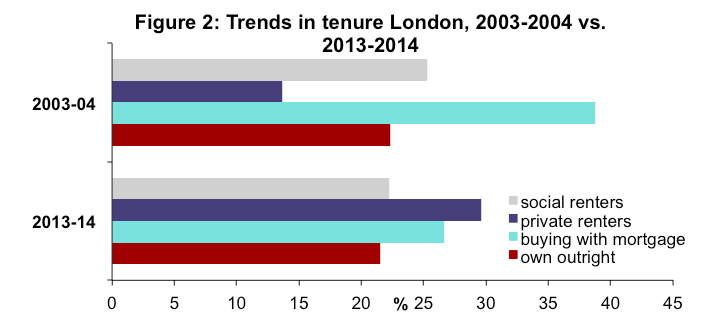
In 2004 14% of London’s households were rented and 39% of households had a mortgage- compared to 2014, where the private renters sector (30%) overtook households buying with a mortgage (26.5%).
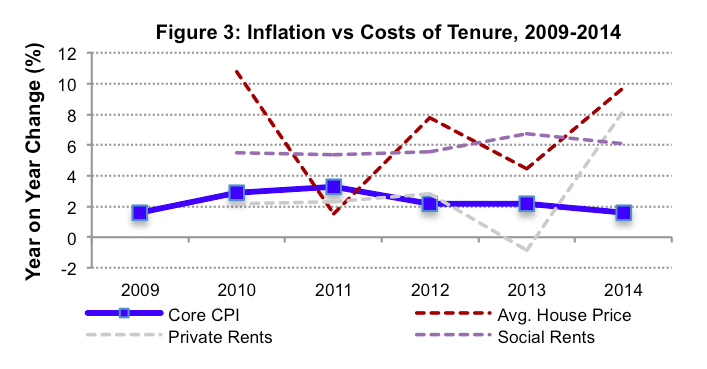
As Positive Money has highlighted for many years, the increase in the average house prices has vastly outpaced the level of consumer price inflation- where CPI has increased at an average of 2.4% from 2010 to 2014, while average house prices have increased at 6.9% for the same period. However, the report also shows that social rents, and now private rents, exceed levels of inflation by a great deal, 4% and 6% respectively (Figure 3: Inflation vs. Costs of Tenure, 2009-2014).


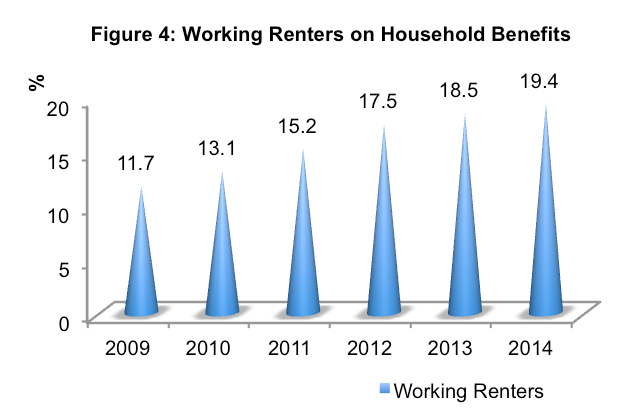
The increase in private rents is particularly worrying seeing as the number of households with children that are renting privately has tripled since 2004 – where roughly half a million families rented, and now 1.5 million rent. Indeed, as more and more people are forced into renting and as rent prices are increasing, it is hardly surprising that the number of working households applying for housing benefits has increased from 1 out of 10 in 2009 to 1 out 5 in 2014.


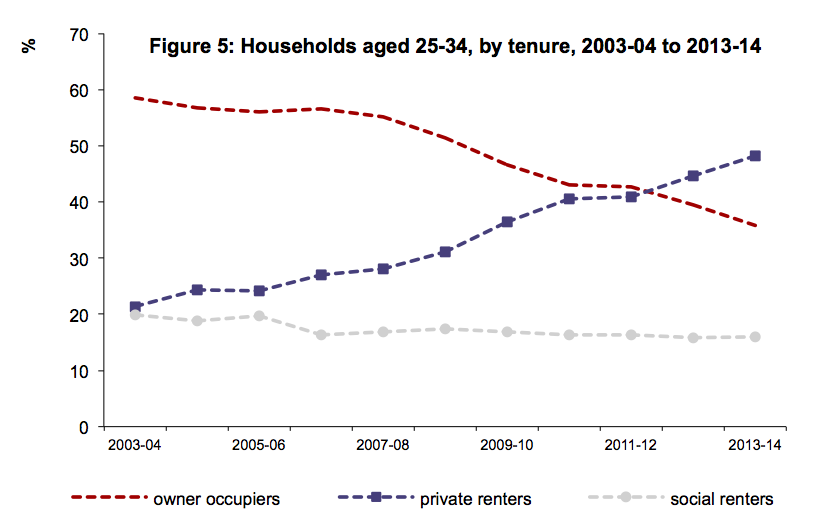
Perhaps the most startling figures released in the report are those that show that households between the ages of 25-34 are being priced out of the housing market. Just 10 years ago, 60% of this age group owned their own property – while currently this figure crumbled to nearly 36%. In a corresponding fashion, the number of private rents more than doubled from 21% to 48% for this particular age category, over the same time period. If this trend continues, then the gap in intergenerational inequality will only become increasingly profound.


An earlier report, released in December 2014, by the national housing federation shows that first-time buyers are twice as reliant on their parents for support for a deposit, compared to five years ago. Indeed, currently 66% of first-time buyers require financial support from a parent in order to get a mortgage, compared to 33% of first time buyers in 2009. Land and home ownership appears to be moving away from a capitalist framework back to a more feudalist set-up, as David Orr chief executive of the National Housing Federation remarks,
“Home ownership is quickly becoming an exclusive members’ club… Sadly, it will depend on the wealth of the family you were born into as much as your own hard work.”
For a while now Positive Money has suggested that increasing house prices and the various problems associated with them, are not only due to a shortage of housing (see “Why are house prices so high?”). The money created through private bank lending has helped house prices soar. For example in the lead up to the financial crisis, the money created by private banks for purchasing a house quadrupled in the UK, whilst house prices for the same period tripled. For the same period, the housing stock increased faster than population growth. On another note, house prices in Portugal, Spain, and California sky rocketed despite the housing stock well exceeding demand for new houses.
While statistics around housing must always be treated with caution, it appears that there are other organizations, who understand money creation, that seem to be catching on. According Merryn Somerset Webb of Money Week,
“Capital Economics picked up the story in a note out earlier this week. It notes that from 2004 to 2014, the number of households in the UK rose by an average of 170,000 a year, but the number of dwellings in the UK increased by some 200,000 a year. That suggests a rise in the number of “apparently surplus homes” to around 1.3 million.”
It is important to note that at Positive Money we believe that the housing situation here in the UK is exceptionally complicated. We do believe house prices are high because there is a shortage of housing, but our point is that this only shows one side of a complex story. Thus, we aim to demonstrate another side, that house prices are also influenced by the large sums of money that banks create out of thin air.
Our endeavour is even more important when considering that almost every politician solely attributes increasing house prices to a housing shortage, while 7 out of 10 members of parliament wrongly believe that only governments can create money, and only 1 out of 10 members of parliament knows that banks create money every time they make a loan. Therefore, in order to create any sustainable change over the long run, we need our representative decision makers to understand that soaring house prices are the consequence of a housing shortage as well as the ability of private banks to create money out of nothing.
——
The report is split in two. Part 1 looks at the socio-dynamics of households (i.e. demographics, economic composition, mortgage difficulties etc.), and is based on a sample of 13,276 households. On the other hand, Part 2 specifically focuses on the actual housing stock, (meaning the physical dwelling- i.e. the avg. age/size/type of home etc.), 12,498 occupied or vacant buildings.