Finance and DemocracyUK
18 December 2025
July 18, 2023
New analysis reveals the value of privately rented homes in England jumped an average of 432% between 1990-2022 – winning landlords more wealth than the GDP of South Africa. This is the outcome of decades of broken housing policies designed to turn homes into financial assets.
This year, rising interest rates have pushed the long-stretched English housing market into further woe. New housing Minister Rachel Maclean, the 15th since 2010, has to face the results of decades of poor management by her predecessors: the loss of social homes, the erosion of public spending on homes, excessive and risky mortgage lending to people who won’t live in the homes they are buying (13% of mortgages go to landlords), and lack of action on private investors pumping money into housing and inflating prices.
All are connected, but one particular chain of policy decisions currently coming to a head is the massive expansion of the private rented sector (PRS). Between 1990 and 2020, the PRS doubled in size, with over 2.6 million more homes rented out privately.
From the 1950s, successive politicians of all stripes have sought to increase rates of homeownership and encourage people to store wealth in their homes – the so-called ‘property-owning democracy’. Through a combination of tax changes, relaxed rules on mortgage lending and social home sell-offs, house prices began to rise. This inevitably attracted the interest of investors, a trend accelerated by the introduction of specific policies to encourage landlord investment. First, the 1988 Housing Act made buying a home to rent more financially and logistically attractive. It phased out rent controls (which had been in place in some form in the UK since 1915) and introduced Assured Shorthold Tenancies, under which landlords can evict tenants more easily. Then, in 1996, the Buy to Let (BTL) mortgage was introduced, a bespoke financial product for landlords. Today, 61% of tenancies are covered by a BTL mortgage, with most opting for interest-only BTL mortgages (meaning they don’t need to pay off the loan, just cover the interest), a cheaper option that has largely been denied to homeowners since the 2008 crash.
Today, high interest rates, modifications to their healthy range of tax benefits, older landlords retiring and many landlords’ unwillingness to pay for legally required climate retrofits to decarbonise the building stock and keep tenants warm are driving them to sell up. In doing so, they are cashing in on the precipitous house price rises of the last thirty years.
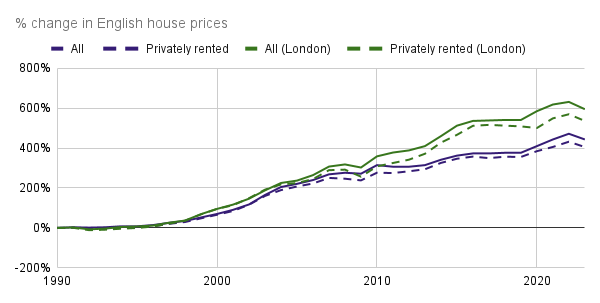
Figure 1: % change in nominal house prices since 1990, assuming a 5% decline in house prices in 2023. Source: Positive Money, 2023.
As Figure 1 shows, house prices have rocketed since 1990, increasing fourfold in England by 2020, and sixfold in London. Adjusting for inflation, this represents a 186% and 234% increase respectively (2020 prices).
The same trend has held true for the value of privately rented homes. Overall, privately rented homes tend to be worth less than owner-occupied homes, in large part because they are more likely to be flats. But nonetheless, private rented homes have jumped in value by 432% between 1990-2022 (or, 143% adjusted for inflation in 2020 prices). Privately rented homes in London were worth 569% more in 2022 than in 1990 (or 206% adjusting for inflation, in 2020 prices).
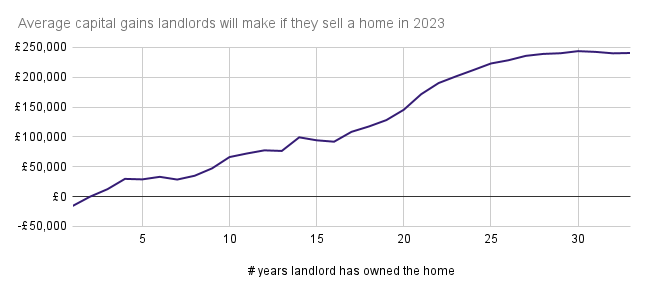
As a result, any landlords cashing out of the market this year are likely to gain significant amounts of wealth. Figure 2 shows the average capital gain that would be banked by a landlord who sells a property in 2023, depending on the number of years they’ve owned it – this assumes a 5% decline in 2023 house prices relative to 2022. This shows that landlords could make up to quarter of a million pounds per average English rental property they sell thanks to house price rises. The 2021 English Private Landlord survey revealed that 53% of landlords had been active since at least 2010, since which time the average privately rented home has increased in value by a third – winning the owner an average of £76,413 in property wealth. That’s an average of £5,878 per year, on top of any rental income they receive, and even accounting for falling prices in 2023. Only for the 8% of landlords who have bought homes in the last 5 years is there a risk of slim capital gains – though they may, of course, choose to wait until house prices rise again in future before selling.
Figure 2: the average capital gains per home for landlords cashing out in 2023, assuming a 5% average house price decrease relative to 2022. Source: Positive Money, 2023. Nominal prices.
In fact, many landlords could bank significantly more if they sell their full portfolios this year, since the 2010 English Private Landlord survey also revealed that 51% of landlords owned more than one home. A fifth (22%) of landlords have been active for more than 11 years, and currently own 2-4 homes – if they’ve owned 3 homes since before 2010, they can expect to win at least £216k in capital gains. For the 10% of landlords who own 5-24 homes and have been active for over 11 years, average capital gains from selling up their portfolios in 2023 would start at £360k – 1700k.
3 years or less4-10 years11 years+1 home7%20%16%2-4 homes1%14%22%5-9 homes<1%2%7%10-24 homes<1%3%25-100 homes<1%1%100+ homes<1%
Figure 3: proportion of landlords by the number of years they’ve been landlords, and the number of homes they own today. Source: English Private Landlord survey, 2021.
This trend also varies regionally (Figure 4). In London, landlords who’ve owned homes for just ten years will sell for an average of £131,028 more than they bought it for in 2013. If they have owned the home since the early 1990s, they will, on average, make over £400,000 (£13-15k per year). In the North East, gains are notably lower, with any landlords who are selling up after owning a home for ten years making an average of £12,000 in capital gains, but those who bought the home in 1993 making close to £100,000. Landlords in the South East, and East of England will all bank an average of around £100,000 if they’ve owned a home for 15 years. Landlords who bought homes in the early 1990s will be averaging capital gains higher than £100,000 in all regions of England.
# Years home owned51015202530England£28,767£66,153£94,263£145,473£223,053£243,733East Midlands£25,187£68,101£54,551£85,181£145,241£153,581East of England£28,045£97,052£108,012£151,492£235,482£249,195London£18,792 £131,028 £194,388 £274,188 £398,028 £433,988North East£7,141£11,858£5,148£50,348£87,408£92,618North West£20,188£39,945£35,965£80,985£125,295 £134,455South East£26,809£100,469£103,709£150,559£245,219£267,139South West£24,702£71,335£69,965£109,545£189,715£207,745West Midlands£27,971£52,341£54,871£82,571£145,891£155,951Yorkshire and the Humber £19,783 £35,746 £34,856£79,866£126,966£129,566
Figure 4: the average capital gains that landlords will make if they sell one home in 2023, by the number of years they have owned it and the region the home is in. Source: Positive Money analysis, 2023. Nominal prices.
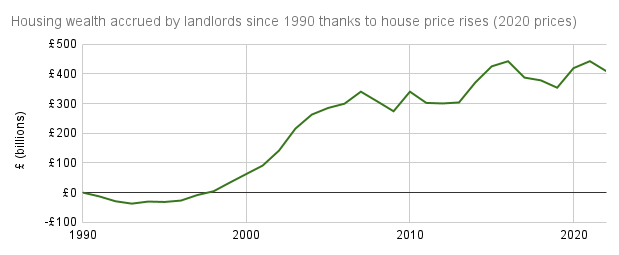
As a group, landlords gained billions in property wealth between 1990-2022 (Figure 4). While the value of the private rented sector in 2022 reached £1,316 billion (2020 prices), landlords only spent a net total of £697 billion (2020 prices) on bringing homes into the private rental sector between 1990-2022 – a difference of £614 billion (2020 prices). £209 billion was in property landlords already held in 1990, i.e. wealth accumulated by the sector long-term, meaning £409 billion comes entirely from house price rises of the existing and new stock since 1990.
Figure 5: value of additional property wealth in the PRS between 1990 and 2022 (change in total value of the PRS less the net amount spent or cashed in). Source: Positive Money, 2023. Real prices.
In England, private landlords must pay capital gains taxes of 18-28% when they sell their homes. However, they can reduce these fees significantly, by avoiding up to £40k of taxes if they have lived in the home, by offsetting any capital gains losses across multiple home sales, and by discounting the costs of extensions, upgrades and retrofits. Some landlords may be paying themselves via companies, in which case they will pay 25% in tax, but be able to reduce their bill through inflation adjustments (if they bought the property before 2017) and claiming Business Asset Disposal Relief. In either case this is a significantly lower rate of tax than the 45% that higher rate taxpayer landlords (around half of landlords, according to gross income data in the Private Landlord survey) would pay if it was income earned from work.
On top of these tax breaks, landlords are significantly wealthier than the national average. According to the English Private Landlord survey, in 2021 the median landlord earned £46k (rent and other income before taxes). A third of landlords earn £60k+, and the mean income for landlords was £93k, thanks to a large number of extremely high earners renting out homes. Other government datasets from 2016-18 indicated that the median landlord had saved over £55k. In comparison, the national average was £7k – and just £400 for renters.
Most landlords who sell rental homes this year will make thousands of pounds thanks to long-term house price rises. This is on top of the rental profits and the other sources of income they have accrued over the years. This is striking at a time that renters are paying record proportions of their income on rent. However, it is a disparity that is the fruit of decades of government policy that encourages people to invest in homes as financial assets, with little attention to the profound wealth inequalities that this produces. We urgently need to rebalance this broken system, ensuring that everyone, whether renting, buying or sharing, can live somewhere safe, affordable and of decent quality.
We would like to thank Trust for London for generously funding this project.


