Back to Archive![12 highlights from 2022]()
![PositiveMoney - Post]()
![PositiveMoney - Post]()
![PositiveMoney - Post]()
![PositiveMoney - Post]()
![PositiveMoney - Post]()
6 April 2018
Bank of England Working Paper Considers Monetary Policy’s Effect on Inequality
Ever since the Bank of England embarked on its £445 billion quantitative easing programme and cut interest rates to record-low levels, it’s faced criticism that these policies have boosted inequality.


Ever since the Bank of England embarked on its £445 billion quantitative easing programme and cut interest rates to record-low levels, it’s faced criticism that these policies have boosted inequality. Positive Money is pleased to see that staff at the Bank have made their most comprehensive effort to date to investigate what exactly the distributional implications of recent monetary policy have been for different households. In a staff working paper, researchers consider the distributional effects of the bank rate cut from 5.5% in late 2007 to 0.5% by the beginning of 2009 and the first £375 billion of quantitative easing (QE) on income inequality, wealth inequality and its impact on different age groups.
The researchers use data from the ONS Wealth and Assets Survey on household characteristics and balance sheet positions for the time period between 2008-2014. They’ve set out to compare what happened to household wealth and incomes over that period, relative to what would have happened if the Bank had made no changes to monetary policy at all. In this hypothetical scenario, the paper projects a higher drop in GDP, house and equity prices along with a higher rate of unemployment than actually occurred.
There are some aspects of the analysis that we welcome, and others where we feel it falls short. As Positive Money has already highlighted, by measuring the changes to wealth and incomes in both proportional and actual terms, they convey a more honest picture of how different groups have been affected. Mark Carney has previously defended the distributional effect of monetary policy based on the fact that the richest cohort of households have seen the smallest boost to their wealth and incomes. But this research found that when viewed in cash terms, the richest 10% of households received a boost to their wealth of over 116 times more than the poorest. This is attributed to wealth and income being unevenly distributed from the onset of the crisis where the top 10% of households by income and top 10% by wealth held approximately 25% of aggregate income and just over 50% of wealth respectively.
When analysing these distributional effects, the paper focuses on six main channels of monetary policy transmission. These are:
Net interest income, where a reduction in interest rates benefits borrowers and makes savers worse off.
Net financial wealth, where holders of financial assets such as equities are made better off by the support of accommodative monetary policy.
Employment and wages where looser monetary policy boosts demand and supports employment and wages.
Effects of inflation on debt and deposits, which reduces their real value when they are fixed in nominal terms.
Net property wealth, where owners of existing houses see their wealth increase by higher house prices but future home owners are adversely impacted by higher future house prices.
Net pension wealth: where effects of monetary policy on pension assets and claims are considered.
Their research shows that most households benefited overall relative to what would have happened otherwise – that is, if accommodative monetary policies were not pursued. They estimate that around a third of households were £500 or more worse off due to lower interest income, but once the channels of financial, property and pension wealth are considered this proportion falls to 4%.
Income inequality
The authors highlight two channels through which monetary policy is likely to have affected real incomes. Interest income on savings was negatively impacted by the low interest rate policy pursued and labour incomes were positively affected by lower unemployment and higher wages than what would have otherwise occurred, if the said policies were not implemented.
The income Gini coefficient – a measure of inequality where coefficient of 1 designates total inequality and 0 total equality – is shown to have changed marginally with an 0.001 decrease. The charts below show the impact of monetary policy on income distribution by income decile in cash terms (Chart 13) and percentage terms (Chart 14):


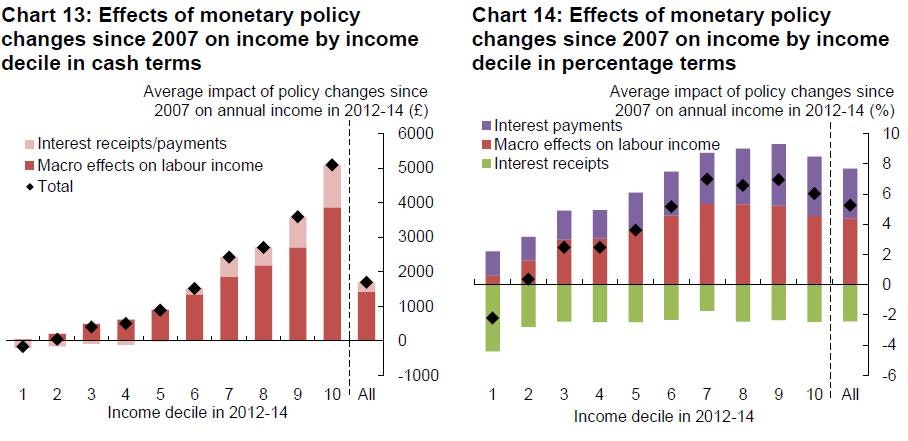
In cash terms labour incomes increased significantly more toward the top end of the income distribution relative to the bottom, a difference which is more muted in percentage terms. Even so, the differences show smaller gains for those in the bottom end of the income distribution with larger gains toward the top income deciles.
Their estimates suggest that households income from savings to have fallen by similar proportion as a result of lower interest rates with those toward the lower end experiencing the largest fall at around 4% of total income in comparison with 2% which is the case for the rest of the income deciles (Chart 14).
Wealth inequality
Wealth inequality showed a slight decrease of 0.017 as measured by the Gini coefficient in comparison to the scenario where the Bank did not adopt accommodative monetary policy. This is mostly due to the positive effect of monetary policy on housing wealth, which is a more important source of wealth in the middle of the distribution and inflation eroding the real value of debts, countering the positive effects of the said policies on financial and pension wealth which account for a higher share of wealth in upper deciles.
Nevertheless between 2006-8 and 2012-14, in cash terms the wealthiest 10% of households saw a marginal increase in their measured real wealth of £350,000 whereas for the bottom 10% this increase was £3000 as seen in Chart 15 below:


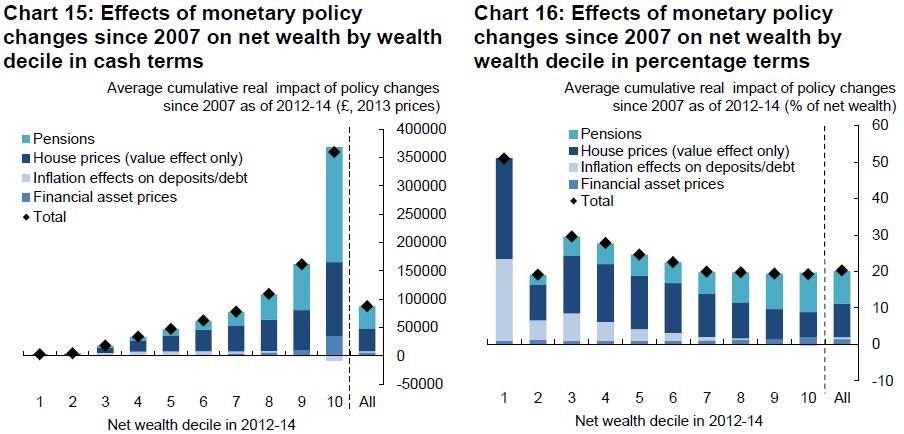
Chart 16 on the other hand shows that the percentage increase of wealth at the bottom of the wealth distribution was significantly higher than at the top. As the authors note this is due to the fact that the “net wealth of this group is close to zero and therefore even very small absolute changes in wealth can be large in percentage terms”.
Distributional effects by age
Overall the crisis had a greater negative impact on younger households than older households. This is seen in both real income and net wealth terms as indicated by charts 9 and 10 below:


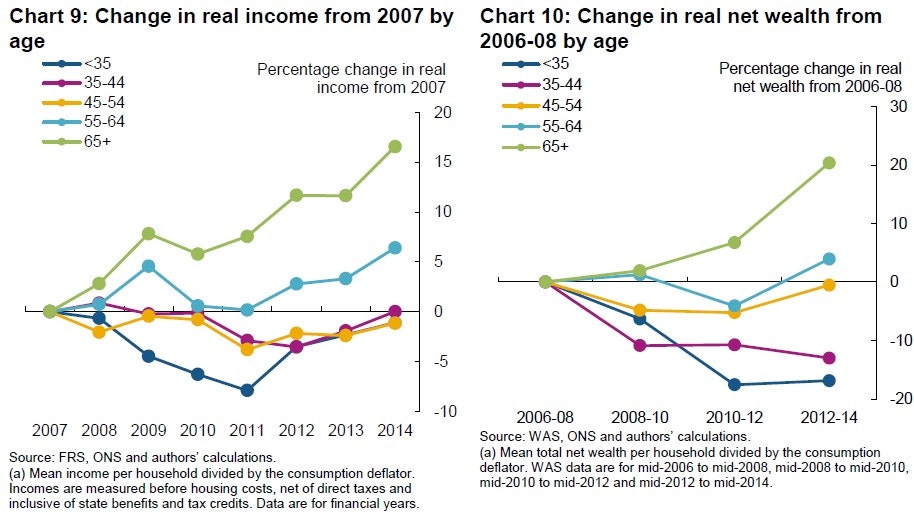
The reason behind this is that older households tend to be retired and therefore not at work so they are less likely to be affected by the unemployment and low wage growth that ensued during and after the recession. In wealth terms, they were better off due to housing wealth and higher pension wealth as lower interest rates push up the value of both.
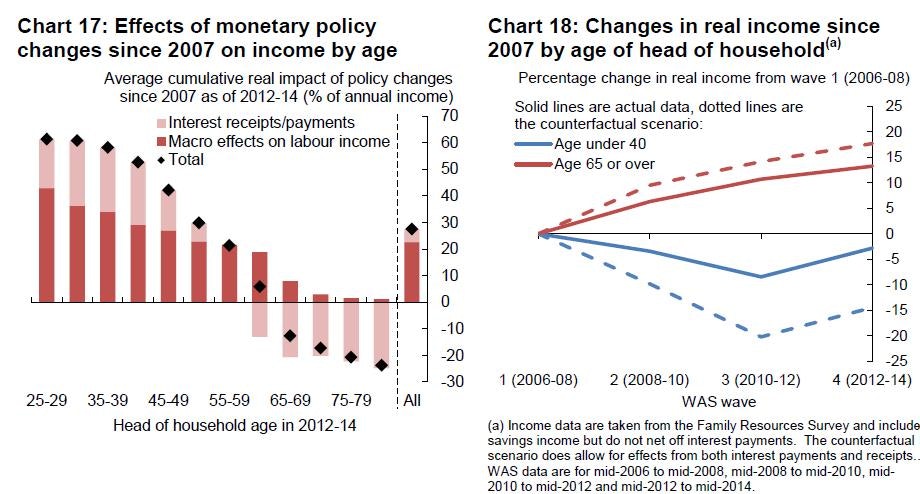
Nevertheless, the loose monetary policy pursued did more to support the incomes of younger households than older ones. The analysis implies that younger households’ real incomes would have fallen by much more than they actually did and that older households real income rose less than they would have, had these policies had not been pursued (Chart 18 below). For example, as older households are more likely to be savers and younger ones borrowers, the former were negatively impacted by lower savings income and the latter benefited from lower interest payments on debt. The same goes for the effects of monetary policy for wages and unemployment which disproportionately affected younger people who tend to be at work (Chart 17).


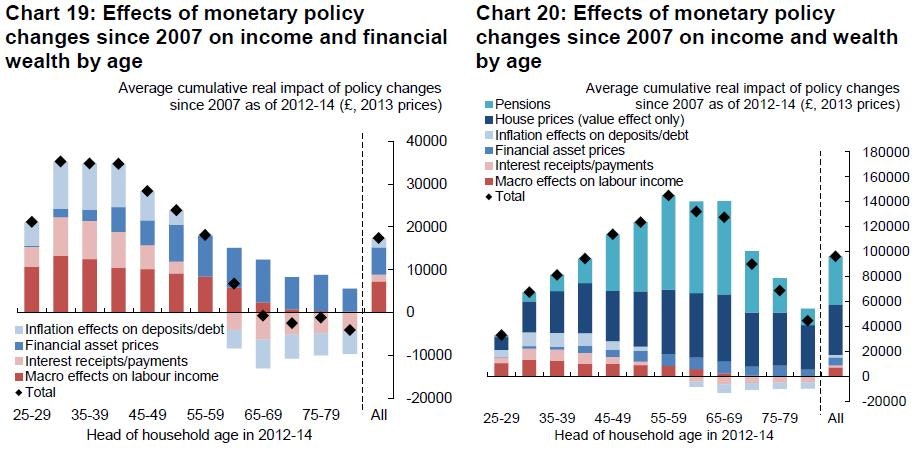
This picture is different when the marginal increases of financial, housing and pension wealth are considered. Older households gained significantly more on all three areas with respect to younger households even though lower interest rates and higher inflation decreased their savings income and eroded their deposits (Charts 19 & 20 below):


Although it is pleasing to see that Bank staff are considering the implications of monetary policy on income and wealth distribution, it is disheartening that the policies pursued simply perpetuated existing injustices. Even though their research claims that there were minuscule decreases in wealth and income inequality as measured by the Gini coefficient, the reader is reminded that this is based on the counterfactual scenario of a greater recession due to the Bank not implementing QE and interest rate reductions. Even under this scenario the richest 10% see a marginal increase in their measured wealth over 116 times greater in absolute terms than the poorest 10%.
But as Positive Money has made clear, there are alternative monetary policies which could have been pursued in order to mitigate the effects of the 2007 crisis. QE for people is one example. Monetary stimulus could have circumvented financial markets, being placed directly into the hands of citizens. Instead of boosting the price of unequally distributed assets, this money would mostly be spent in the real economy, directly increasing demand. This policy could also have been designed in such a way as to ease existing social injustices. It would be interesting to see analysis from the Bank consider this scenario and address the trade-offs between different options for monetary policy following the crisis.