Back to Archive![12 highlights from 2022]()
![PositiveMoney - Post]()
![PositiveMoney - Post]()
![PositiveMoney - Post]()
7 February 2018
Latest wealth data shows disproportionate gains to the rich during era of QE
Analysts will be watching the Bank of England closely this Thursday for any hints about its plans to raise interest rates.


Analysts will be watching the Bank of England closely this Thursday for any hints about its plans to raise interest rates. But despite rumours of further hikes, it’s worth remembering that we’re still living in an unprecedented era for monetary policy. Interest rates have been below 1% for nearly a decade, and quantitative easing has seen the Bank’s balance sheet balloon several times over. The effects of these extraordinary measures are far reaching. New data out this week is a reminder of their dramatic impact on inequality in the UK.
The latest ONS Wealth and Assets Survey, released last Thursday, once again showed the sheer extent of wealth inequality in the UK. A comparison of percentile figures with those from the previous wave suggests households in the wealthiest 10% gained on average nearly 700 times as much as the poorest 10% between 2012-2014 and 2014-2016.
The average total wealth of the of the bottom 10 percentile households rose by £330 between 2012-2014 and 2014-2016 (from £5,293 to £5623). The average total wealth of the top 10 percentile households increased by £229,541 over the same period (from £1,663,912 to £1,893,453).


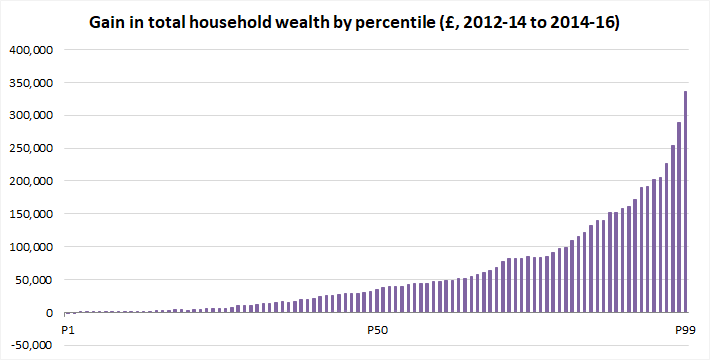
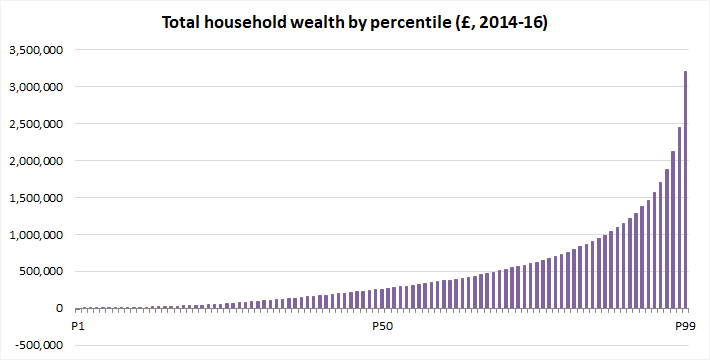
The distribution of total wealth across UK households is extremely unequal. Naturally, so too are the gains in wealth in recent years.
The figures are significant because they are the latest to contradict the position taken by Bank of England governor Mark Carney in a 2016 speech, when he used the ONS data to claim that the “poorest have gained the most” from the Bank’s quantitative easing programme. As Positive Money showed in an analysis from October last year, the Bank painted a misleading picture by using relative rather than absolute figures. Data from the the 2006-08 to 2012-14 waves of the Wealth and Assets Survey showed an absolute gain for the wealthiest 10% almost 200 times greater than that for the poorest.
In part, this story represents the plain fact that capital begets capital. In 2014, Thomas Piketty popularised the dominance of the return to capital (r) over the growth of the economy (g). He wrote how the concentration of wealth at the very top reproduces itself. The household at the 99th percentile in the UK – that is, entry-level into the wealthiest 1% – is currently sitting on £3.2 million. Small wonder their returns are so vast.
However, the Bank of England’s policies have much to answer for in driving this inequality. Low interest rates drive cheap borrowing, driving speculation and pushing up the price of assets. That includes house prices as well as stocks and shares. Moreover, bond purchases under the Bank’s quantitative easing programme poured billions of pounds into financial markets. Much of this money has found its way into inflated asset prices.
Part of the reason why monetary policy fuels wealth inequality is its effect on financial assets. As the past month has shown, investing in the stock market can generate enormous wealth extremely fast. Of course, very few people actually hold this sort of wealth. The gini coefficient – a measure of inequality – is 0.91 for financial wealth among UK households; for total wealth it is 0.62, for property 0.67.
Wealth inequality doesn’t look quite so bad when households are arrayed by their income – there are some low earners that are very rich, and some high earners who aren’t. But the difference between the top income decile and the bottom in terms of financial wealth is stark. Crucially, these sort of assets generate a return – in the form of interest or dividends – that can overshadow wage earnings.


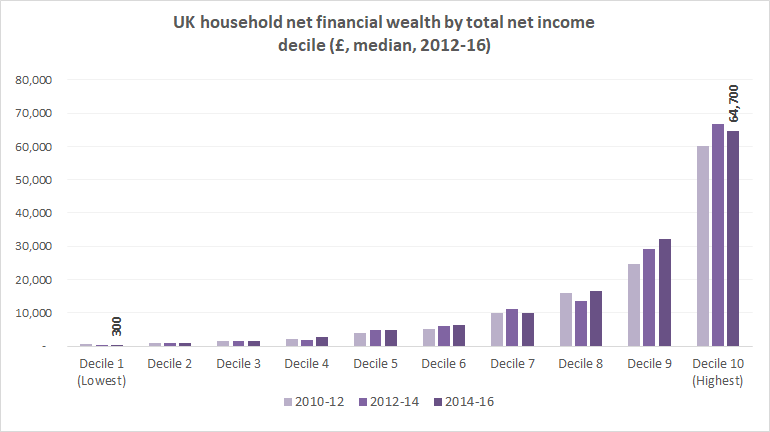
The financial wealth of the highest earners has in fact fallen since the last wave of the Wealth and Assets Survey. Wealth has been transferred to private pensions and property, which make up the bulk of the recent boost enjoyed by the richest. But extraordinary monetary policy measures have undeniably helped widen the gap between rich and poor. And their gains beget further gains. The UK’s richest households – hoisted to lofty heights by Bank of England policy – can sit back and let Piketty’s r > g do its work.