Back to Archive![12 highlights from 2022]()
![PositiveMoney - Post]()
![PositiveMoney - Post]()
![PositiveMoney - Post]()
![PositiveMoney - Post]()
28 September 2017
The UK economy is hooked on rising asset prices. What happens when the bubble bursts?
UK household real wages have just experienced their worst decade since the 1860s, and are still falling.


UK household real wages have just experienced their worst decade since the 1860s, and are still falling. A concern is building that a private debt crisis might threaten the UK economy. In a piece for the New Statesman, David Graeber warned ‘we’re staring into the lights of an oncoming train’.
It’s certainly true that UK households are spending more than their income at an unprecedented rate. In the first half of 2017, they ran a deficit of £6.0bn, an annualised deficit of £12bn (i.e. £6 bn *2). This means the average UK household is set to spend an astonishing £440 more than its income this year. As a percentage of GDP in the chart below (see the green line), this is the highest household deficit recorded in over a century:


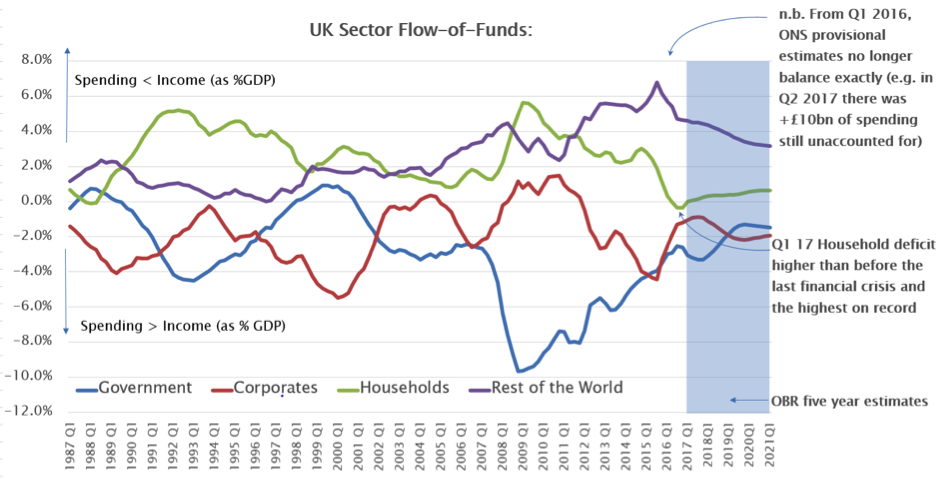
Source: Positive Money (using OBR and ONS provisional data, 4Q rolling average)
Without the benefit of such unprecedented household spending, the inconvenient truth is that the UK economy would be in recession today. In short, we need this household deficit to offset excess saving elsewhere in the economy. However, when this deficit can no longer be funded, the economy will stall. Household spending is being financed, in part, by rising consumer and student loan debt – set to increase by a record £31bn this year:


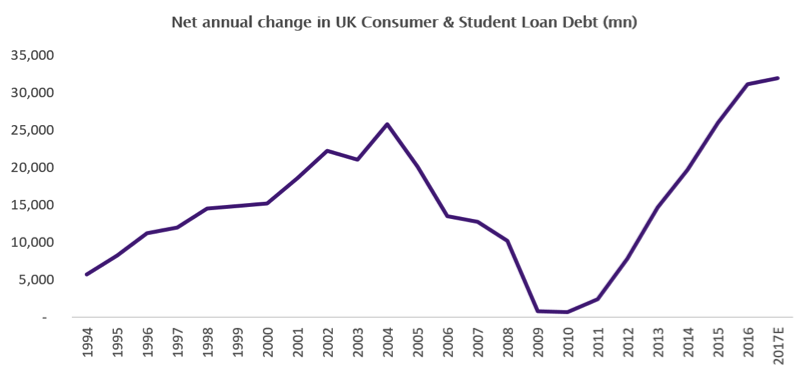
Source: Positive Money (using BoE, Student Loans company data): UK households are today accumulating £9bn pa in PCP car loans, £5bn pa credit card, £4bn other (e.g. overdrafts) and £13bn student loans.
We’ve seen this script play out before. Like stretching elastic, the more consumer debt is expanded the harder it becomes, and the greater the risk of a painful snap back. Those who worry about the UK economy often express concern about this rising level of debt. It is certainly alarming that UK consumer and student loan debt will rise to £314bn this year (above its last peak). The oncoming train analogy does seem appropriate.
But what if there’s not just one train, but two? Where the second train is actually larger and therefore even more dangerous: The risk of an abrupt fall in the price of UK household assets.
The importance of asset prices, rather than just debt, can be understood using the data from the above two charts. We know UK households are set to spend £12bn more than their income this year and that this figure includes a non-cash household saving of £49bn from accrued private pension entitlements. Therefore, households total cash spend more than their income is in fact £61bn (£12bn + £49bn). We already know that higher consumer and student loan debt is set to fund £31bn of this. But this leaves a funding gap of £30bn. Where is the money coming from?
The answer to this also helps explain an even more basic question: why on earth is the average UK household currently happy to spend £440 more than its income this year? The answer to both is not debt, but capital gains. Capital gains on a truly spectacular and unprecedented scale. A decades long decline in interest rates has caused the price of almost all financial assets – from houses to bonds and equities – to rise. In fact, since 1980, UK households have enjoyed an annual boost to their net wealth equivalent to 25% of GDP for over thirty-five years; this has utterly dwarfed anything they’ve been able to save out of their income:


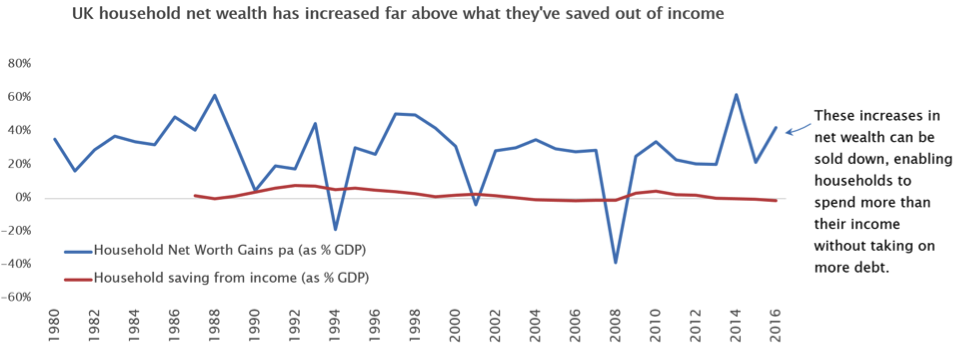
Source: Positive Money (using ONS data)
This truly extraordinary windfall has given some lucky UK households both the motive as well as the added means to spend. After all, many can afford to run deficits when the value of their assets is rising even faster. Assuming these assets can be sold to savers (e.g. Rest of World) or those purchasing the assets using debt (e.g. mortgages), the capital gains that are released allow households to spend more than their income without so much as touching a credit card. With no red-ink left behind, this is the source of our £30bn funding gap for UK households.
The Bank of England is aware of this powerful mechanism. Straitjacketed by its mandate to generate 2% inflation, its QE program was introduced explicitly to inflate a ‘wealth effect’ to get households to spend. In Q1 2010, UK household saving peaked at £21bn per quarter. But by Q1 2017, household savings had reversed to running an unprecedented £6bn semi-annual deficit. This swing in spending (equivalent to 7% of GDP) has been the main driver behind the UK’s moribund economic recovery.
To get households to spend a little bit more, we’ve had to make some people a great deal wealthier. But what helped to drive up household spending as asset prices rose, risks driving their spending down when the situation reverses. The ratio of UK household net wealth to UK household disposable income has now risen to an astonishing 8.6:1, the highest level for any developed economy ever:


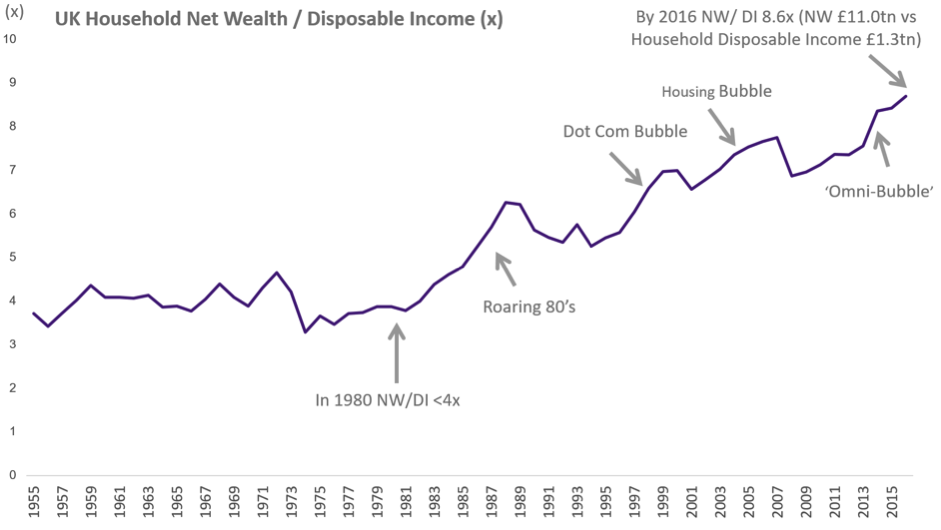
Source: Positive Money (using ONS data)
The risks of a private debt crisis are real enough. But the existential threat is that this will happen together with the bursting of the greatest asset bubble in modern economic history, just at the point when the BoE has no room to lower interest-rates. When consumer credit stops flowing and debtors try to pay back the money they owe, and when financial asset prices can no longer defy gravity, UK household spending will plummet. Then maybe, in a weak voice, we will ask one more question: why was no one able to foresee this?
The article appeared originally on the Open Democracy website and was re-published on 09/10/2017 by Brave New Europe.
Note: This article differs from the original version due to significant revision to ONS historic sectoral flow-of-funds, as well as to incorporate the latest Q2 2017 data.