Back to Archive![12 highlights from 2022]()
![PositiveMoney - Post]()
![PositiveMoney - Post]()
![PositiveMoney - Post]()
5 July 2017
Alarming data casts grave doubt on the sustainability of the UK’s economic growth
UK households are saving less than they ever have.


UK households are saving less than they ever have. The latest ONS data puts the UK household saving rate at just 1.7% in the first quarter of 2017 – the lowest rate since records began in 1963:


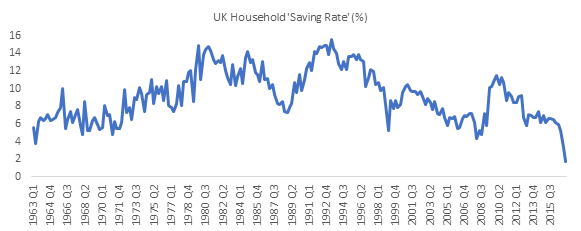
Source: ONS data
This 1.7% savings rate (£5.5bn/£318bn) is calculated as the percentage of UK household disposable income saved after what they have spent on consumption goods and services. But over the quarter, UK households also spent on investment goods (e.g. buying new-build homes or doing up existing ones). In Q1 2017, once we include this expenditure, UK households spent £17.5bn more than their income.
More alarming is the fact that, had they not done so, the UK economy would likely have fallen into recession. This is because this household deficit of -£17.5bn along with the government’s -£7bn deficit was needed to offset £12bn savings by corporates and the UK’s £17bn current account deficit[1] (caused by the UK importing more than it exports, net payments of asset income and UK fiscal transfers abroad). It’s worth noting that the UK household deficit has only ever been higher in the months preceding the last financial crisis:


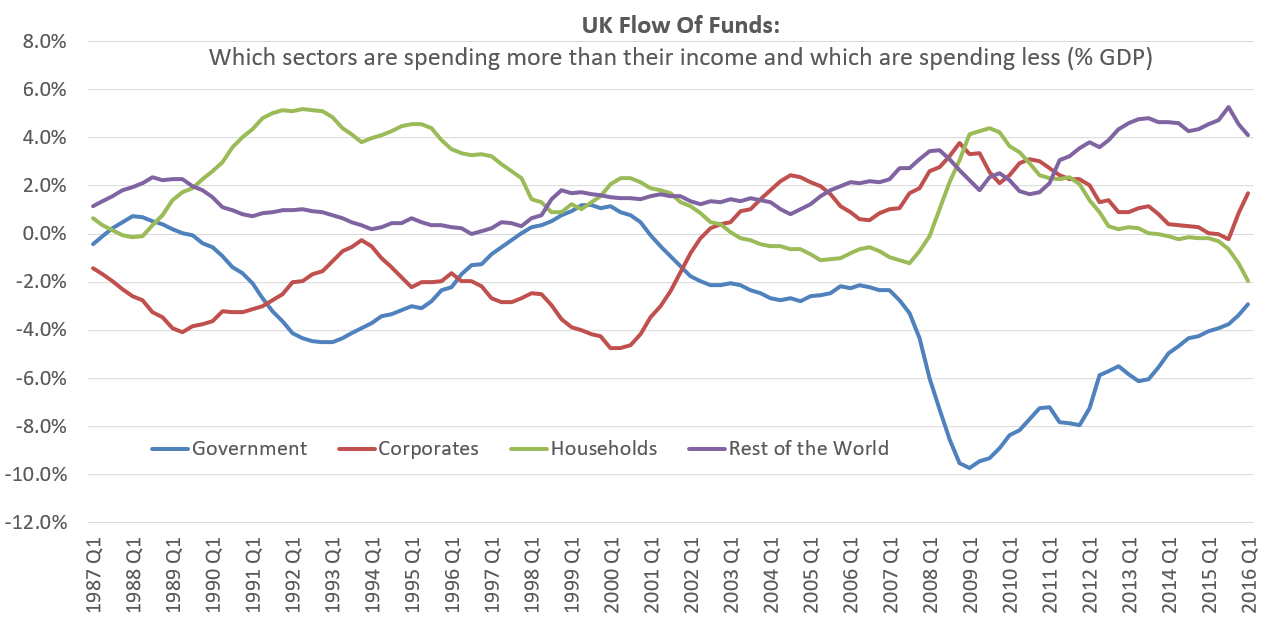
Source: ONS data
The risk is that UK household spending is not sustainable. There are currently many UK households that simply cannot save – as they must spend all their income to get by. There are also other households who can, but don’t feel the need to save, because their net worth (e.g. house values or investments) has been rising so dramatically. These latter households can only be expected to maintain spending at current levels so long as they continue to enjoy the same rapid financial asset inflation year on year. This effect is visible in the following chart – when asset prices have been rising sharply, the rate of UK household saving has fallen:


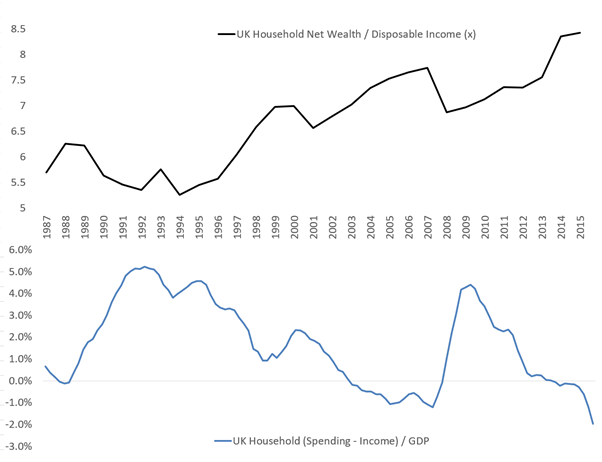
Source: ONS data
But asset prices cannot continue rising forever. We are approaching the limits of this process around zero interest rates and QE. Today, UK asset prices have now reached the highest level relative to incomes, for any developed country, ever. As soon as UK households no longer anticipate further annual rises in the value of their houses or portfolios, their spending will likely fall – potentially significantly – enough to cause the next UK recession.
The second risk is how UK households have been financing this emergent deficit. On an annualised basis UK households are spending £70bn more than their income (Q1 £17.5bn *4). We may strip out the savings by the richest 1% of households to calculate that ‘the 99% of UK households’ are actually spending £90bn more than their income every year[2]. Where is this money coming from?
A large minority is coming from increasing debt. Outstanding student loan debt is going up £13bn every year (its total has now reached £100bn) and total UK consumer debt is increasing at a rate of £20bn every year (its total has now reached £200bn). The majority of the money needed (£57bn = £90bn – £33bn extra debt) is instead being financed by households either leveraging up their assets (e.g. rising mortgage debt) or selling them to the top 1% or foreign buyers. None of these mechanism of finance are desirable, nor can they last.
—–
[1] The sum of these four figures should sum to zero as total expenditure = total income. But this ONS data is provisional, so there is a £4.5bn deficit spending that they must still account for as their estimates improve.
[2] i.e. The top 1% of UK Households earn 10% of household disposable income. If we assume they save just 15% of this (as richer households are known to save more) then this savings figure is £20bn (£1290 *10% *15%)