The Bank of England’s depiction of inequality data is dangerously misleading

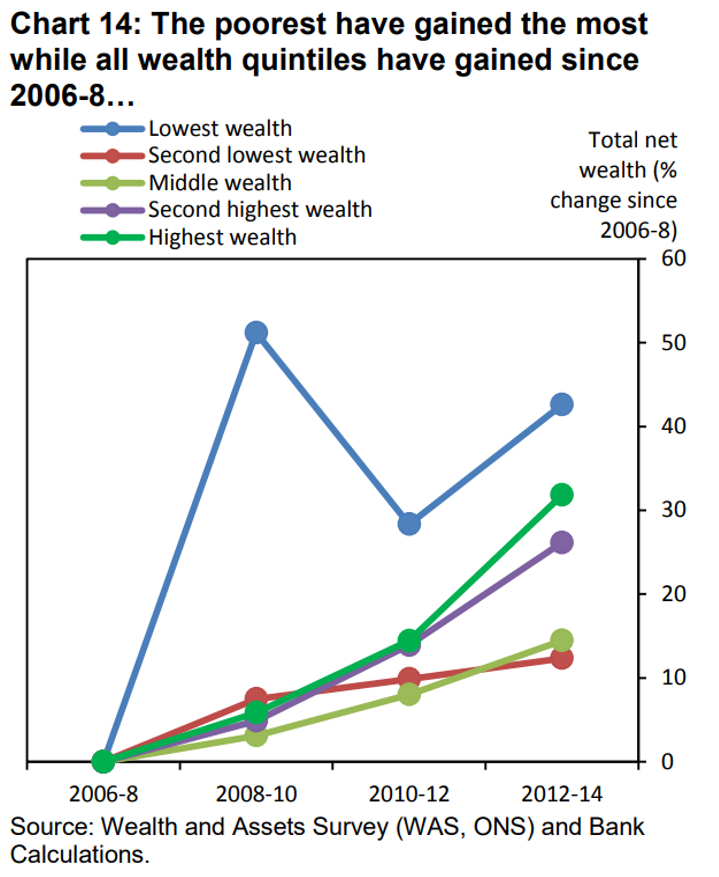
In an important speech in Liverpool in 2016, Mark Carney defended the Bank of England (BoE) against the charge that QE has caused inequality to worsen. He posed the question ‘has monetary policy robbed savers to pay borrowers? Has the MPC been Robin Hood in reverse?’ But his answer was emphatic: ‘In a word, no.’ In support of this conclusion he presented the following slide:

Figure 1: Chart used by Mark Carney to argue that the poorest have gained the most since 2006-8 (Source: http://www.bankofengland.co.uk/publications/Documents/speeches/2016/speech946.pdf)
This was a bold statement indeed, and so the chart merited closer scrutiny. What were the actual figures behind the chart and how might they look on an absolute, not relative, basis? After a full seven weeks of correspondence involving the Bank, the wealth and assets survey (WAS) division of the ONS and a helpful lady at the UK data archive, Positive Money was finally able to get some answers.
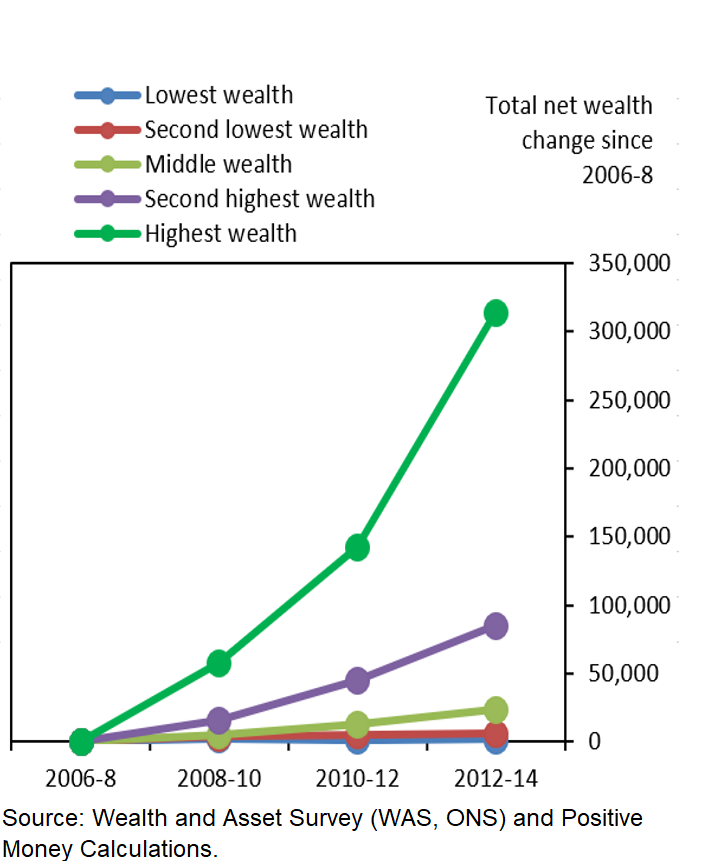
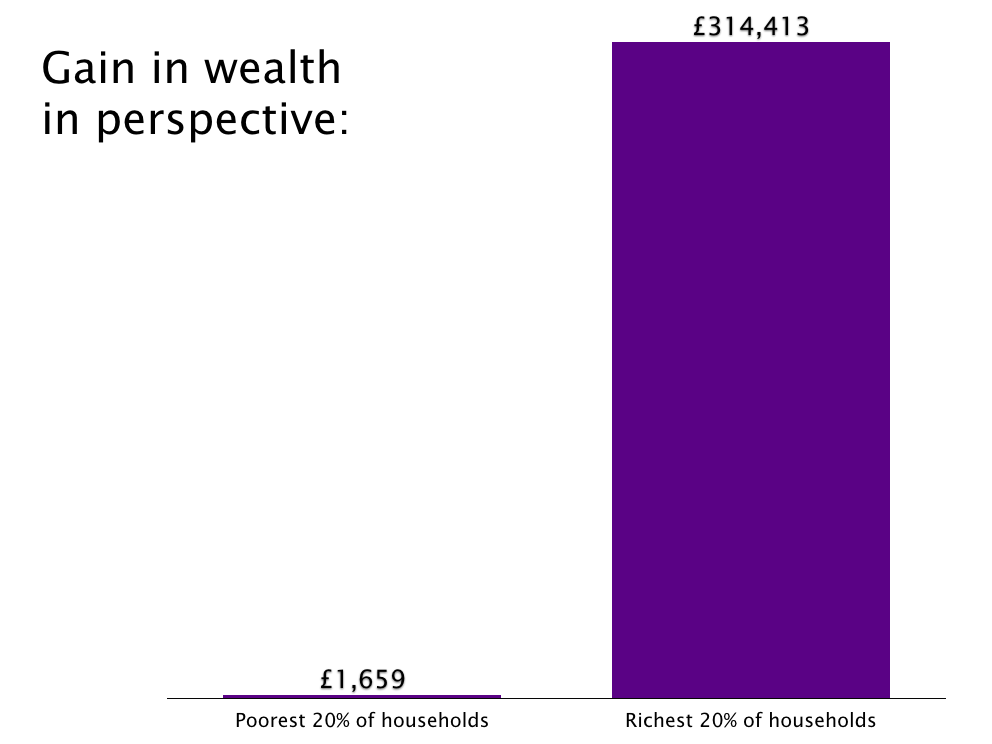
The raw data behind the above chart was eye-opening. The 43% recorded increase in net wealth of the poorest fifth of households reflected a £1,659 increase in net worth (from -£3,896 in 2006-08 to -£2,237 in 2012-14). Meanwhile, the 32% recorded increase in net wealth of the richest fifth of households reflected a £314,143 increase in net worth (from £987,209 per household to £1,301,352). The wealth gain for the top fifth was therefore 189 times that of the lowest:

Figure 2: The very same data presented on an absolute, rather than proportional, basis.
Only when shown in absolute terms does the true disparity in gains between groups over this period become clear. The Bank’s choice to present this data in proportional terms, together with its chosen title, did far more to hide these facts than to illuminate them. The governor has painted a potentially misleading picture of the effects of QE and other extraordinary monetary policy. The full, unmediated picture shows that such policies are benefitting the rich on an unprecedented scale at the expense of future generations of asset owners.

In the same speech, the governor went on to say that
‘all monetary policy has distributional effects, but it is rightly the role of elected governments to take measures to offset some or all of those’.
But this can only happen if the government is given a fair and accurate picture of what the distributional effects have been.
It is time we had a much more honest debate about the effects of monetary policy. In evidence to the Treasury Select Committee today, the MPC member Silvana Tenreyro said:
“it’s far from evident that QE has contributed to higher inequality. Certainly not according with what we’ve seen in the UK”.
The Bank’s own analysis in 2012 showed that £335bn of QE may have directly contributed to a £600bn increase in UK household financial wealth, suggesting that the current total of £445bn QE may have prompted a total increase of £800bn. With the top 1% of UK households owning 20% of net wealth, this would mean that each of these households gained an average increase in financial net wealth of £590,000. When combined with dramatic increases in non-financial wealth – including housing – the top 1% of households are likely to have benefitted by more than one million pounds each. Can the governor explain what measures he has in mind for the government to ‘offset some or all’ of this windfall? My colleague Rob Macquarie will consider the impossibility of such action in a separate piece soon.
The Bank should not hide behind its inflation mandate to the exclusion of all other considerations. If it finds itself unable to achieve its 2% inflation target, without causing generational shifts in inequality, it must say so. Our democracy needs the Bank of England to be fully transparent about the impact of its policies. Rather than allowing monetary policy to continue to fuel inequality, there should be an urgent discussion about how stimulus can be better designed to boost the economy in a fairer and more sustainable manner.